Produced by Kantar Emor
Updated: live report, updated monthly
Language: English (Original title: Balti tarbijaturu trendid)
Format: MS Power BI
About this report
This report examines market potential, economic and consumer trends in Estonia, Latvia and Lithuania. Information provided here is of crucial interest to marketers, researchers and planners. This report includes trends and dynamics since 2001.
Report covers the following topics:
- Demographics and social
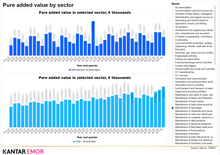
- Economy
- Retail sector
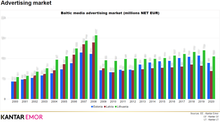
- Media and advertising
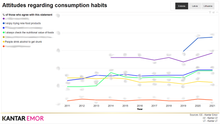
- Consumer behavior and consumption patterns
- Transport sector
- Environment
- Tourism and entertainment
Table of contents:
- Main indicators
- Population
- Population pyramids
- Generation population
- Urbanisation
- GDP
- CPI and wages
- Financial status
- Pensions
- Unemployment rate
- Retail sector
- Retail turnover and gross salaries
- Retail business yearly turnover
- Food retail
- Online shopping
- Consumer attitudes and consumption patterns
- Attitudes regarding grocery shopping
- Household consumption
- Attitudes: Consumption habits
- Consumption of different food categories
- Consumption of non-alcoholic drinks
- Consumption of alcoholic drinks
- Media and advertising
- Advertising market
- Advertising expenditure
- Share of advertisements in media sources
- Media trust
- Transport sector
- Passenger transport
- Cars
- Electric cars share
- Social
- Household main goals
- Gini Index
- Biggest problems (TOP10)
- Consumer confidence indicator
- Predicted change in household financial status
- Satisfaction with life
- Education
- Environmental
- Importance of European Green Deal objectives (I/II)
- Importance of European Green Deal objectives (II/II)
- Tourism, free time and entertainment
- Net occupancy rate of bedplaces in hotels
- Tourism turnover
- Nights spent
Methodology
Data provided in this report is based on Kantar research findings – Kantar Emor, Kantar Latvia, Kantar Lithuania - and public resources like Eurostat, Statistics Estonia, Statistics Latvia, Statistics Lithuania. The data is updated quarterly if new data is available.
Technical info
This report is delivered electronically as interactive Power BI dashboards.
A link providing access to the Power BI report will be emailed to you within two business days upon confirmation of your payment. The user license is intended exclusively for internal use and is valid for a user group ranging from one to five individuals (1-5 emails). This access link remains active for 365 days starting from the date of dispatch. Should you require access for more than five users, extra fees will be incurred for each additional user.
**VAT is added to the price at the checkout before the payment is completed.
This price is for access to the data for one year.
This is a market research report. Usage terms and policies apply to the content. Please read these carefully before ordering.


